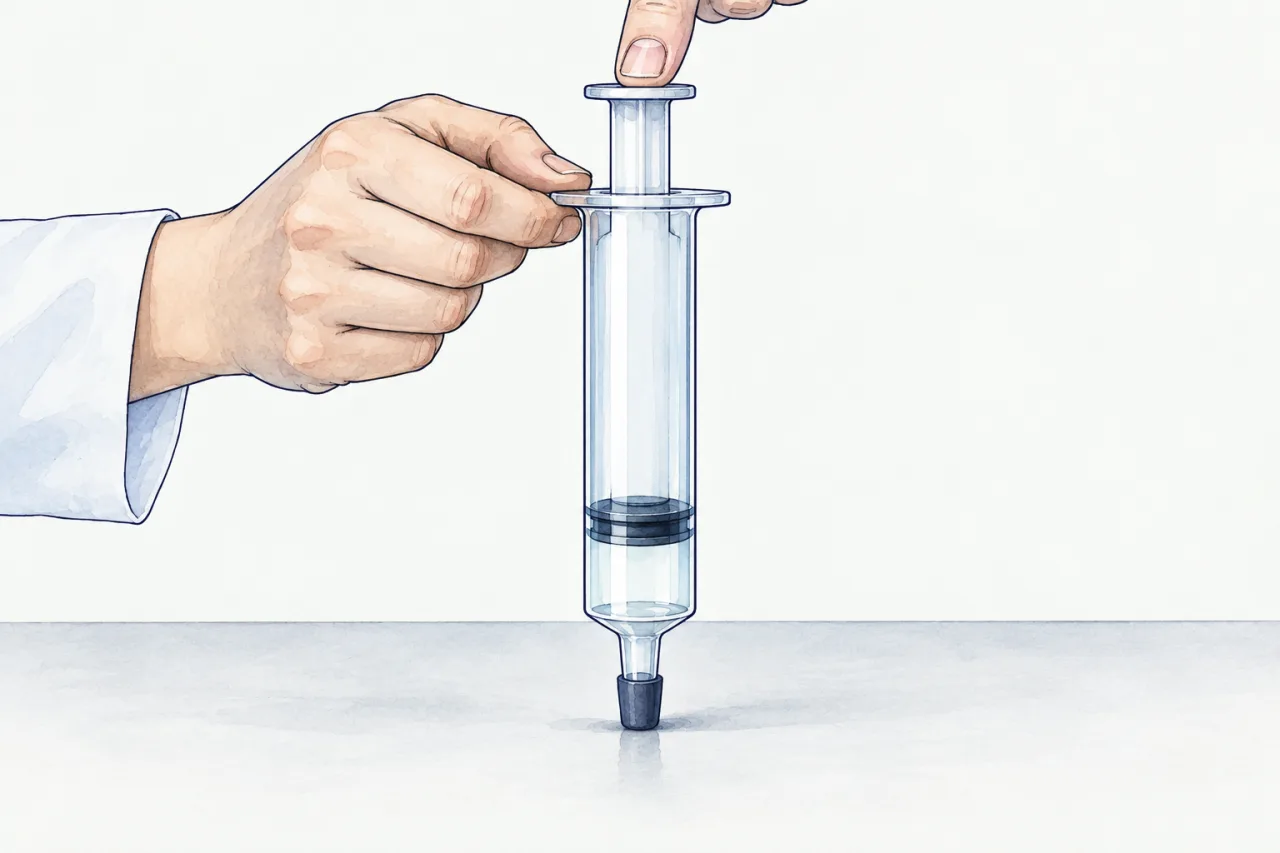
Close the nozzle of a syringe with a rubber cap and push the plunger. At first it slides in easily. The further you push, the harder the trapped air pushes back, and when you let go the plunger springs back out. Nothing has been added and nothing has escaped: the same air, squeezed into less space, pushes harder. What is the air doing to the plunger? In this part you find out what gas pressure is and how it changes when a gas is squeezed. The next part answers the module question: why a sealed can must never be left in a hot car.
 (enlarge)
Particles hitting the walls
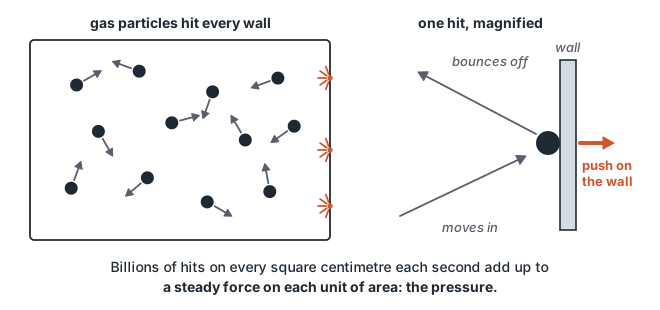
Air is made of particles, mostly molecules of nitrogen and oxygen. In a gas the particles are far apart, with empty space between them, and they move very fast: at room temperature a typical air particle moves at about 500 m/s, faster than a passenger jet. They move in random directions. Every direction is equally likely, and each particle keeps changing direction as it collides with other particles.
When a particle reaches a wall of its container, it hits the wall and bounces off. To turn the particle round, the wall has to push on it, and the particle pushes on the wall just as hard. One hit is a tiny push. But there are so many particles that every square centimetre of the wall is hit billions of billions of times every second. All these small pushes add up to a steady force on the wall. This steady push is where gas pressure comes from; the next section says exactly what the pressure is.
 (enlarge)
A gas pushes on every surface it touches: the walls of its container, a plunger, the inside of a gauge, your finger over a nozzle. Because the particles move at random in all directions, the hits are the same on a wall facing up, down or sideways, so the gas pushes equally in all directions.
Trap: “Gas pressure is caused by the weight of the gas pressing down.” A syringe of air pushes on its gauge just as hard whichever way up you hold it, and on the side walls as hard as on the bottom. The weight of 50 cm³ of air is far too small to matter. The pressure comes from moving particles hitting the walls, in all directions.
Pressure: force on each unit of area
A large surface is hit by more particles each second than a small one, so the gas exerts a bigger force on it. To compare surfaces of different sizes, we use the force on each unit of area: the pressure of a gas is the force of the particles' hits on each unit of area of the surface, such as each square metre or each square centimetre. More hits on each unit of area each second, or harder hits, mean a bigger force on each unit of area: a bigger pressure.
Pressure is measured in pascals (Pa). A pressure of 1 Pa is a force of 1 newton on each square metre. That is very small, so gas pressures are usually given in kilopascals: 1 kPa = 1000 Pa. The air around us has a pressure of about 100 kPa. That is about 10 N, the weight of a 1 kg bag of sugar, on every square centimetre of every surface, including you. You do not feel it, because the air and the fluids inside your body push back just as hard. You will calculate forces from pressures in a later module.
The gauge in this module shows the whole pressure of the air, so 0 kPa would mean no hits at all: a vacuum. A reading of 100 kPa means the air in the syringe pushes on each square centimetre as hard as the air in the room does.
Worked example
A steady push from separate hits
A sealed syringe holds air at 100 kPa. The plunger's end has an area of 4 cm², and the side walls have a much bigger area. Explain, in terms of particles, why the air pushes on the plunger, why the push on the side walls is bigger but the pressure on them is the same, and why the gauge needle stays steady although every hit is a separate push.
The air particles move fast, in random directions. Each time one hits the plunger it bounces off and gives the plunger a small push; all these pushes add up to the force on the plunger. The side walls have more area, so more particles hit them each second and the total force on them is bigger. But because the motion is random, each square centimetre of every surface gets the same number of hits each second, so the force on each unit of area, the pressure, is 100 kPa everywhere. The needle stays steady because there are billions of billions of hits on each square centimetre every second: far too many, too close together, for the gauge to show single hits.
Squeeze it and measure
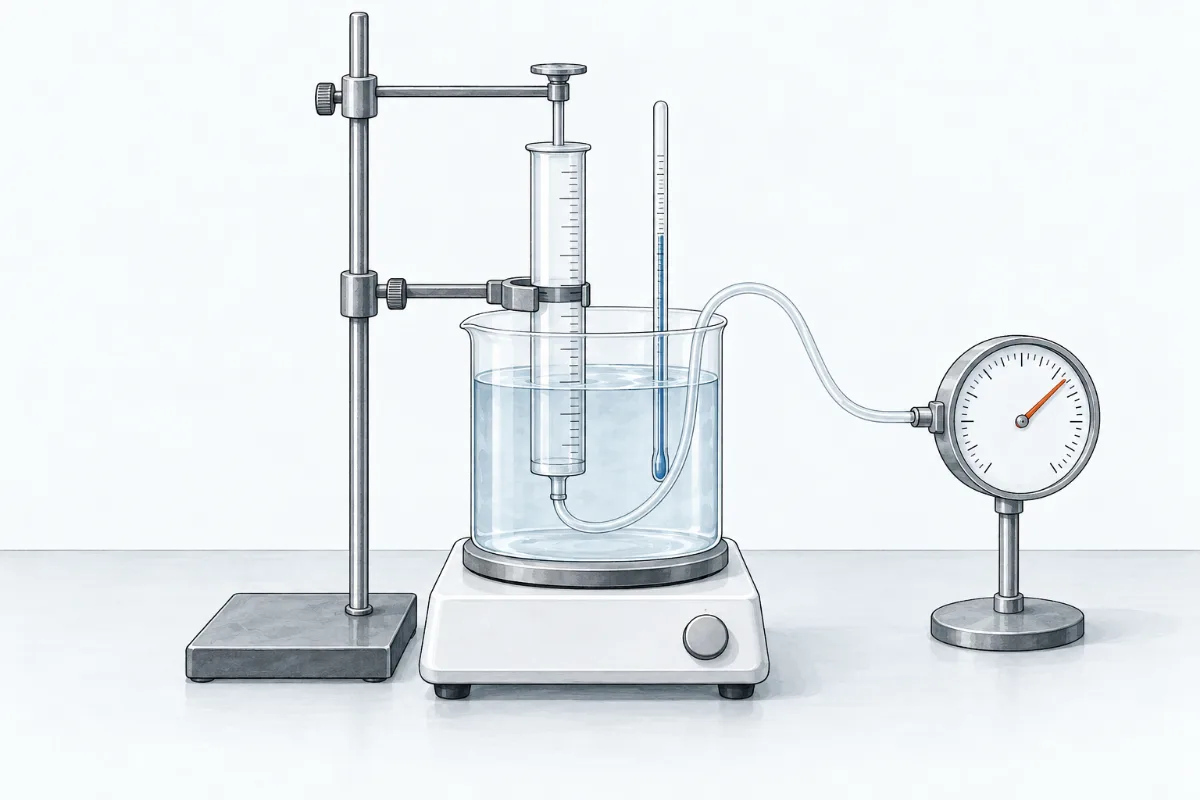
What is on the bench. A glass gas syringe stands nozzle down in a beaker of water, so the air inside it stays at the temperature of the water, 20 °C. A thin tube joins the nozzle to a pressure gauge. A lock on the stand holds the plunger still between steps. A magnifier shows a model of the particles of air inside the syringe.
What you do. Predict first: what will the gauge read when the air is squeezed to half its volume? Then push the plunger in, step by step. Wait each time for the needle to stop, and record the pressure at each volume. Look for a rule that links the pressure and the volume.
 (enlarge)
What the experiment showed
Do the experiment before you read on. At the start the syringe held 50 cm³ of air and the gauge read 100 kPa, the pressure of the air around us. When the plunger went in to 40 cm³, the needle shot up to 129 kPa, then fell back and stopped at 125 kPa. Squeezing a gas quickly warms it a little; the water then cooled the air back to 20 °C. This experiment keeps the temperature the same, so each reading is taken once the needle has stopped.
| V / cm³ | p / kPa | p × V / kPa cm³ |
|---|---|---|
| 50 | 100 | 5000 |
| 40 | 125 | 5000 |
| 30 | 167 | 5010 |
| 25 | 200 | 5000 |
| 20 | 250 | 5000 |
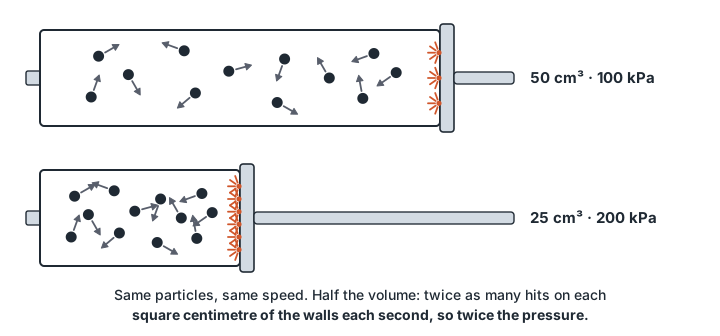
Halving the volume, from 50 cm³ to 25 cm³, doubled the pressure, from 100 kPa to 200 kPa. When the plunger was pulled back to 50 cm³, the gauge read 100 kPa again: no air had got in or out.
Why does the pressure rise? The same particles now have less space: squeezed into half the volume, they are twice as crowded. They move at the same speed as before, because the temperature is the same, so each hit is just as hard. But each square centimetre of the walls is now hit more often: twice as many hits each second. Twice as many hits, each one just as hard, give twice the force on each unit of area: twice the pressure. Let the gas expand into a bigger volume and the opposite happens: fewer hits on each square centimetre each second, so a lower pressure.
 (enlarge)
Trap: “When a gas is squeezed, its particles get smaller, or they speed up.” The particles keep their size, and at a constant temperature they keep their speed too. Only the space between them shrinks, so they hit the walls more often. The brief jump to 129 kPa was the air warming as it was squeezed quickly; once the water had cooled it back to 20 °C, the reading settled at 125 kPa.
Pressure × volume stays the same
Multiply each pressure by its volume and you get the same number every time, 5000 kPa cm³. (30 × 167 gives 5010 only because the reading 166.7 was rounded to 167.) This is true for any gas, as long as two things stay the same: the mass of the gas, so no gas gets in or out, and its temperature. For a fixed mass of gas at a constant temperature:
pV = constant
So if a gas starts at pressure p₁ and volume V₁, and is squeezed or allowed to expand to a new volume V₂ at the same temperature, its new pressure p₂ is given by
p₁V₁ = p₂V₂
Halve the volume and the pressure doubles; make the volume three times bigger and the pressure falls to a third. Check every answer this way: a smaller volume must give a bigger pressure.
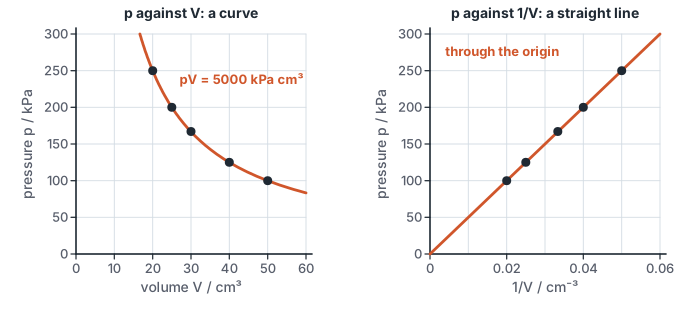
The graph of p against V is a curve. It falls steeply at small volumes, where squeezing out a few more cubic centimetres makes a big difference, and gets flatter at large volumes. It never reaches either axis: however big the volume gets, the pressure never quite reaches zero. The graph of p against 1/V, the same readings plotted against one divided by the volume, is a straight line through the origin. (1/V is measured in “per cubic centimetre”, written cm⁻³: 1/50 cm³ = 0.02 cm⁻³.) That shows that p is proportional to 1/V: the pressure is inversely proportional to the volume. Halve V and p doubles.
 (enlarge)
Trap: “The p–V graph is a straight line sloping down, so p + V stays the same.” From 50 to 40 cm³ the pressure rose by 25 kPa; from 30 to 20 cm³ it rose by 83 kPa. Equal squeezes do not add equal pressure. It is the product p × V that stays the same, not the sum, and its graph against V is a curve.
Worked example
A blocked bicycle pump
A bicycle pump holds 120 cm³ of air at 100 kPa. Its outlet is blocked, and the piston is pushed in slowly, so that the air stays at the same temperature, until the air takes up 40 cm³. Calculate the new pressure.
Fixed mass (the outlet is blocked) and constant temperature (the piston moves slowly), so p₁V₁ = p₂V₂. 100 kPa × 120 cm³ = p₂ × 40 cm³, so p₂ = 12 000 kPa cm³ ÷ 40 cm³ = 300 kPa. Check: the volume fell to a third, so the pressure tripled. A common slip is to work out 100 × 40 ÷ 120 = 33 kPa; but a smaller volume must give a bigger pressure, not a smaller one.
Bubbles that grow
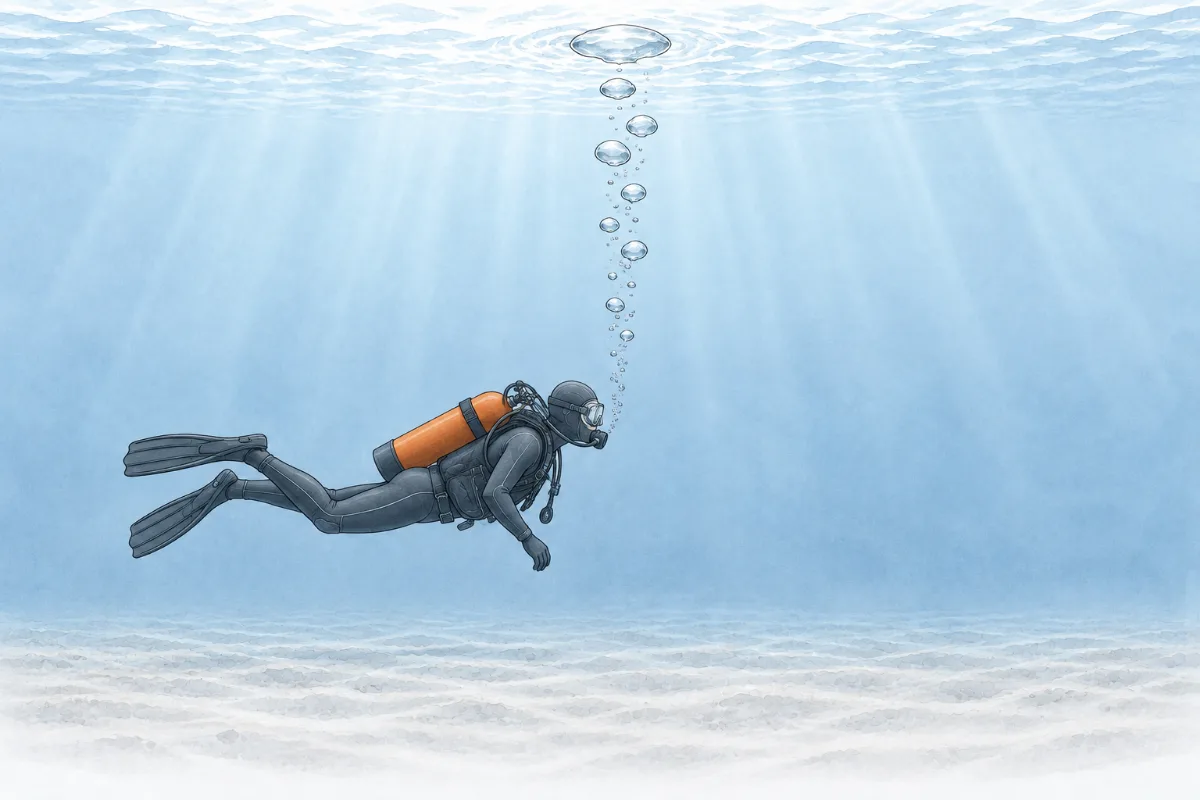
Deep under water the pressure is higher than at the surface; you will find out why in a later module. About 20 m down it is roughly 300 kPa, three times the 100 kPa at the surface. A scuba diver breathes air from a tank at the same pressure as the water around her. Each bubble she breathes out rises into water at a lower and lower pressure, so it grows on the way up: pV = constant.
 (enlarge)
The same thing would happen to the air in the diver's lungs. That is why divers are trained never to hold their breath while they swim up: they breathe out steadily, so the air in their lungs can escape as it expands.
Worked example
A rising bubble
A diver breathes out a bubble of volume 2.0 cm³ where the pressure is 300 kPa. It rises to the surface, where the pressure is 100 kPa. The water is at the same temperature all the way up. Calculate the volume of the bubble at the surface.
The bubble keeps the same air, a fixed mass, at a constant temperature, so p₁V₁ = p₂V₂. 300 kPa × 2.0 cm³ = 100 kPa × V₂, so V₂ = 600 kPa cm³ ÷ 100 kPa = 6.0 cm³. The pressure fell to a third, so the volume tripled. In particle terms: the bubble grows until its particles, now more spread out, hit each square centimetre of its surface only as often as the water around it pushes back.
Case closed
A gas pushes on its container because its particles move fast, at random, and keep hitting the walls and bouncing off. The gas pressure is the force of these hits on each unit of area. Squeeze a fixed mass of gas at a constant temperature and the same particles, at the same speed, hit each square centimetre more often, so the pressure rises: pV = constant, and p₁V₁ = p₂V₂. The graph of p against V is a curve; the graph of p against 1/V is a straight line through the origin. A sealed can of the module question does not change its volume. What changes in a hot car is its temperature, and that is the next part.
About this model
The syringe, the gauge and the water are simulated. The readings follow the ideal-gas rule, and air at these pressures and temperatures behaves almost exactly like this. A real syringe leaks a little and its plunger sticks; this one does not. The thin tube to the gauge holds about 1 cm³ of air, which is left out. The magnifier is a model: 12 particles stand for billions of billions, drawn far bigger than real.