Scope and sources
Cambridge IGCSE Physics 0625 · 2026–2028 v2 · Original learning materials.
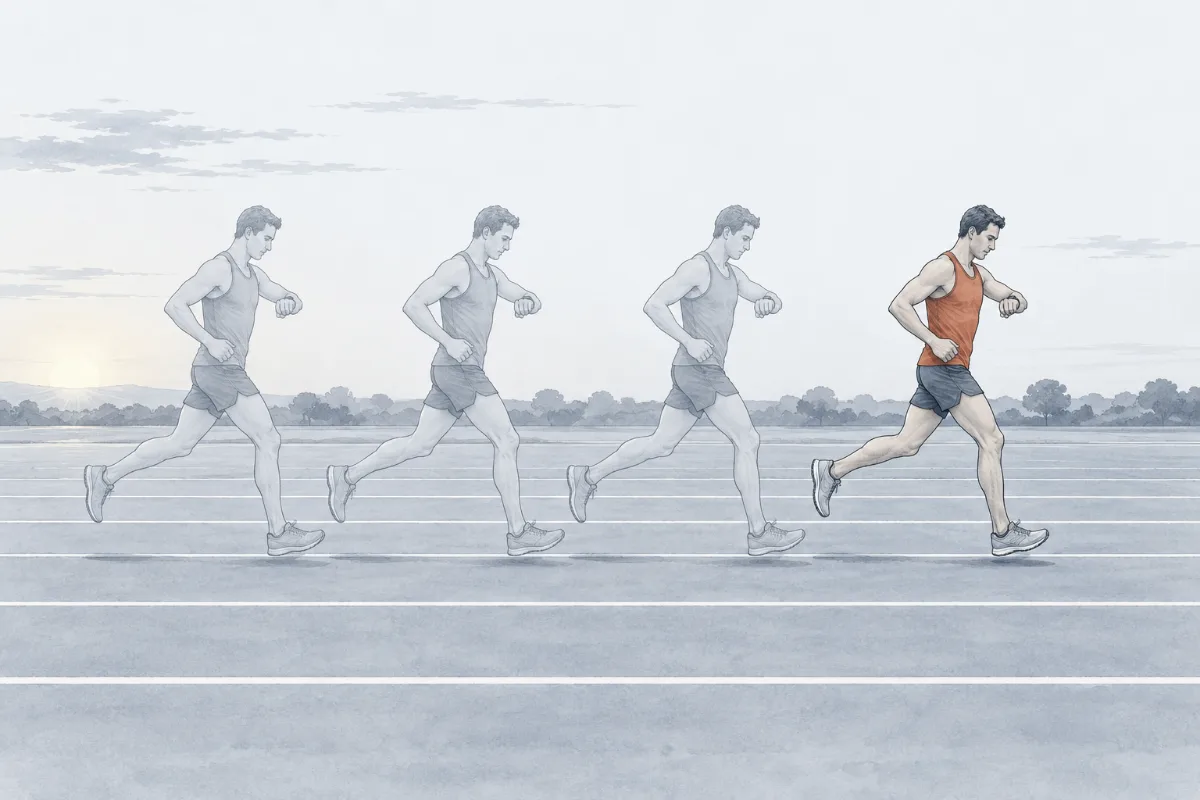
Speed as distance travelled per unit time, v = s/t (1.2.1); velocity as speed in a given direction (1.2.2); average speed = total distance ÷ total time (1.2.3); sketching, plotting and interpreting distance–time and speed–time graphs (1.2.4); at rest, constant speed, speeding up and slowing down from a graph or from data (1.2.5); speed from the gradient of a straight section of a distance–time graph (1.2.6); distance travelled from the area under a speed–time graph for constant speed or constant acceleration (1.2.7). Acceleration as a number, free fall and drag (1.2.8–1.2.13) are in MOT02.
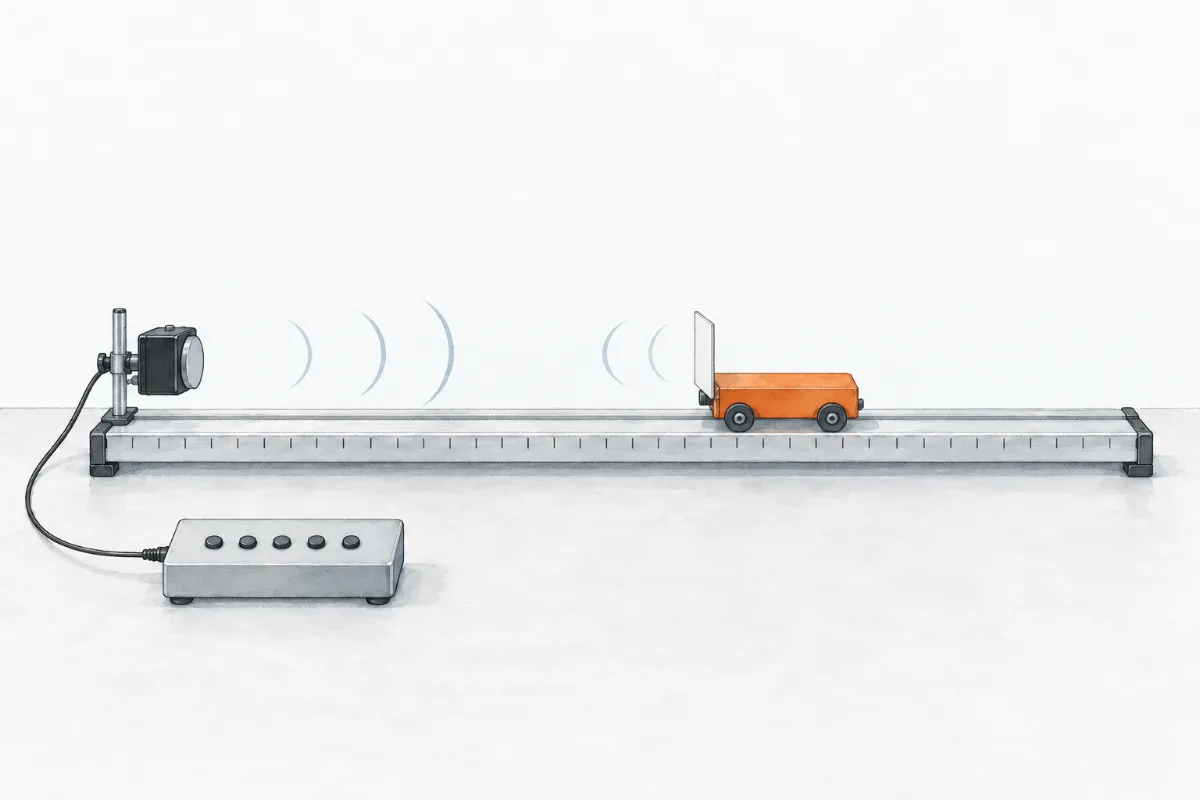
Apparatus, amounts and times in the experiment are illustrative. Real practical work follows a teacher-approved safety method.
Official Cambridge syllabus