A line on a graph can tell a whole journey without a single word: when something stood still, when it moved, which way it went and how fast. In this part you'll learn to read that story, then use it the other way round: you'll look at a graph and plan a trolley's journey so that its live graph lands on the same line.
Speed: how far each second
A trolley rolls 1.2 m along a track in 6.0 s. Another rolls 1.2 m in 3.0 s. Both covered the same distance, but the second one took half the time: it was faster. To compare them, work out how far each one goes in one second.
Speed is the distance travelled per unit time:
v = s ÷ t
where v is the speed, s is the distance travelled and t is the time taken. With the distance in metres and the time in seconds, the speed is in metres per second, m/s. The first trolley: 1.2 m ÷ 6.0 s = 0.20 m/s. The second: 1.2 m ÷ 3.0 s = 0.40 m/s, twice as fast.
You'll also meet km/h on road signs. A speed in m/s tells you how many metres are covered each second; a car on a motorway at 30 m/s covers a football pitch in about three seconds.
Worked example
How fast, how far?
A cyclist rides 150 m along a straight path in 30 s at a steady speed. (a) Find her speed. (b) How far does she ride in 2.0 minutes at this speed?
(a) v = s ÷ t = 150 m ÷ 30 s = 5.0 m/s. (b) Rearrange the equation: s = v × t. The time must be in seconds: 2.0 minutes = 120 s, so s = 5.0 m/s × 120 s = 600 m.
Velocity: speed with a direction
Two trolleys both move at 0.40 m/s, one away from a motion sensor and one towards it. Their speeds are the same, but they are clearly not doing the same thing. Velocity is speed in a given direction.
On a straight track you can show the direction with a sign. In this module, moving away from the sensor is positive and moving towards it is negative. A trolley coming back at 0.40 m/s has a velocity of −0.40 m/s; its speed is still 0.40 m/s, because speed has no direction and is never negative.
Trap: “The trolley coming back has a speed of −0.4 m/s.” Speed is only the size: 0.4 m/s. The minus sign belongs to the velocity, and it only says which way.
A motion sensor draws the graph
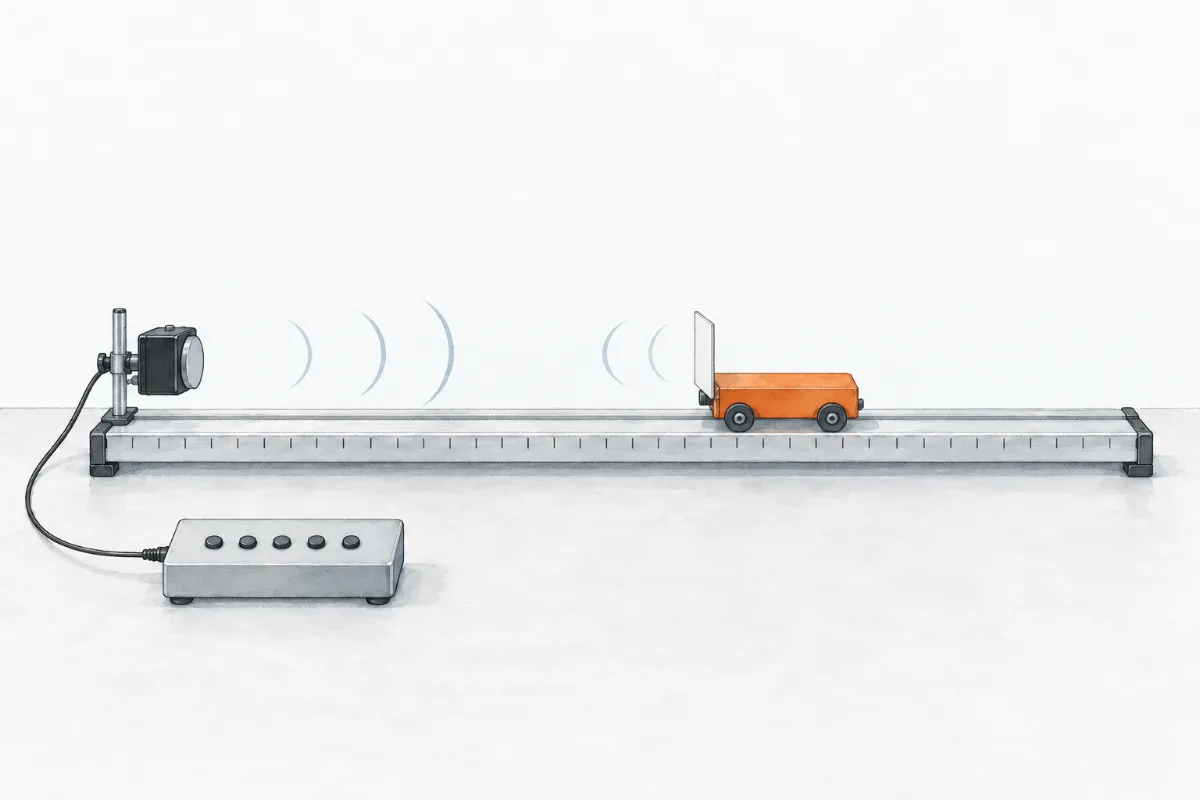
In a school lab, a motion sensor can follow a trolley for you. It sends out short pulses of ultrasound, too high-pitched to hear, and times how long each echo takes to bounce back from a card on the trolley. The longer the echo takes, the further away the trolley is. Ten times a second, the sensor turns that time into a distance from the sensor and a computer plots it against time.
 (enlarge)
The result is a distance–time graph: time goes along the horizontal axis and the distance from the sensor goes up the vertical axis. Each point says where the trolley was at that moment. Read along the line from left to right and you are watching the journey happen.
Reading a distance–time graph
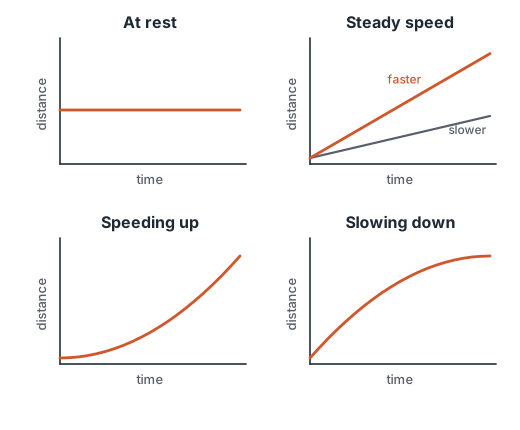
The shape of the line tells you how the object is moving:
- A flat (horizontal) line: the distance isn't changing, so the object is at rest.
- A straight sloping line: the distance changes by the same amount every second, so the speed is steady. A steeper line means a higher speed.
- A curve that gets steeper: each second covers more distance than the last, so the object is speeding up, or accelerating.
- A curve that gets flatter: each second covers less distance, so the object is slowing down, or decelerating.
- A line that falls: the distance from the sensor is getting smaller, so the object is coming back towards it.
 (enlarge)
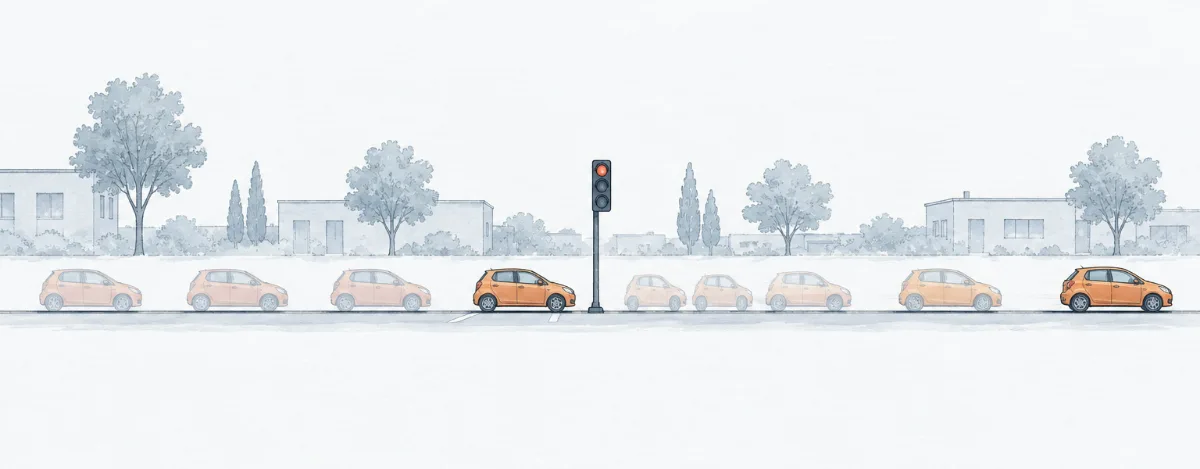
You can tell the same things from data, without a graph. Look at how far the object moves in each equal time interval. If the gaps are all equal, the speed is steady. If they grow, it is speeding up; if they shrink, it is slowing down; if there is no gap, it is at rest. The picture below works like a photo taken every second.
 (enlarge)
Trap: “A falling line means the trolley slows down” or “… goes downhill.” The graph is not a picture of the track. A falling line means the distance from the sensor is getting smaller: the trolley is coming back. Slowing down makes a line flatter, not lower.
Speed from the gradient
How steep is a straight part of the line? Pick two points on it, far apart. The gradient is how much the line rises between them divided by how much time passes:
gradient = change in distance ÷ change in time
That is exactly distance ÷ time:
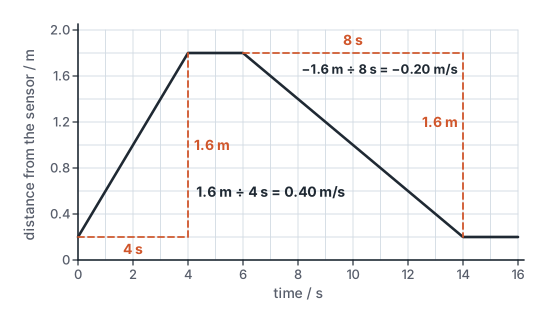
Key idea: On a graph of distance from the sensor, the gradient of a straight part is the velocity. Its size is the speed. Its sign gives the direction: positive moving away, negative coming back.
 (enlarge)
Worked example
Reading speeds from a graph
The graph above shows a remote-control car in front of a motion sensor. (a) Find the car's speed between 0 s and 4 s. (b) What is it doing from 4 s to 6 s? (c) Find its velocity between 6 s and 14 s, and its speed.
(a) The line rises from 0.2 m to 1.8 m while the time goes from 0 s to 4 s. Gradient = (1.8 − 0.2) m ÷ (4 − 0) s = 1.6 m ÷ 4 s = 0.40 m/s. (b) The line is flat: the car is at rest, 1.8 m from the sensor. (c) The line falls from 1.8 m to 0.2 m between 6 s and 14 s: gradient = (0.2 − 1.8) m ÷ (14 − 6) s = −1.6 m ÷ 8 s = −0.20 m/s. The velocity is −0.20 m/s (towards the sensor) and the speed is 0.20 m/s. The falling part is half as steep as the rising part, so the car comes back at half the speed it went out.
Match the target
Now plan a journey yourself, to match a new target graph on the trolley's track. Predict first: in its fourth part the target line falls. What is the trolley doing then? Then read the gradient of each part, set the plan on the controller (wait, move away or come back; a speed; a time) and run it. Does your orange line land on the dashed one?
If your first line missed, the feedback names the part that went wrong. A line that is too steep means the trolley went too fast; a part that ends too late means your time was too long. Reading the gradient of each part gives you every speed in the plan.
Distance from the sensor, distance travelled
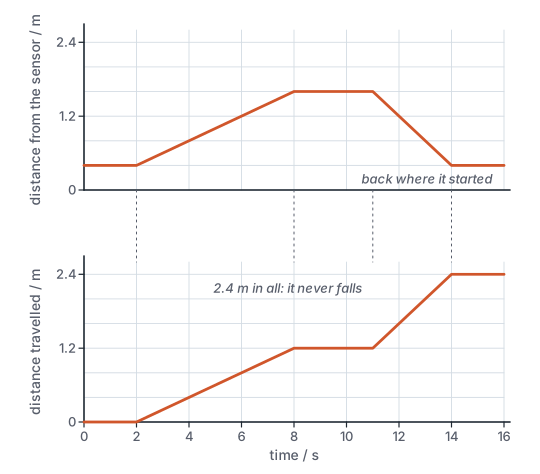
When the trolley comes back, its line falls. But it hasn't “unmoved”: its wheels kept turning. The distance travelled is the length of the path the trolley actually covered, and it can only grow. The distance from the sensor says where the trolley is; the distance travelled says how far it has gone.
 (enlarge)
Average speed
Real journeys stop and start. A bus waits at stops; a trolley waits at the end of the track. To describe the whole journey with one number, use the average speed:
average speed = total distance travelled ÷ total time taken
The total time includes the waiting, because the clock keeps running while you stand still.
Trap: “It ended where it started, so its average speed is zero.” A trolley that goes 1.2 m out and 1.2 m back has travelled 2.4 m, so its average speed is not zero. And taking the average of its two speeds doesn't work either: it spent different times at each speed and some time standing still. Always use total distance travelled ÷ total time.
Worked example
Average speed with stops
The plan for the trolley's target journey: wait 2 s, move away at 0.20 m/s for 6 s, wait 3 s, come back at 0.40 m/s for 3 s, wait 2 s. Find its average speed.
Distance travelled: 0.20 m/s × 6 s = 1.2 m away, then 0.40 m/s × 3 s = 1.2 m back, so 2.4 m in all. Total time: 2 + 6 + 3 + 3 + 2 = 16 s. Average speed = 2.4 m ÷ 16 s = 0.15 m/s. It is lower than either moving speed because the plan has the trolley standing still for 7 of the 16 seconds. (In the experiment the trolley takes a moment to start and to stop, so it stands still for a little less time and moves a little longer. Its motor speeds it up and slows it down at the same rate, so the distance it loses at each start it makes up at each stop: it still travels 1.2 m each way, and the average speed is the same.)
Drawing a distance–time graph
To plot a journey from a table, put time on the horizontal axis and distance on the vertical axis, each labelled with its quantity and unit: “time / s” and “distance / m”. Choose scales with equal steps so the points fill most of the grid. Mark each reading with a small cross.
Then join the points. Where the speed is steady the points lie on a straight line; where it changes they lie on a curve. Draw the line or smooth curve through them, part by part, so you can read values in between.
To sketch a graph from a description, you don't need exact points. Draw labelled axes, then one part for each stage of the story: flat for waiting, a straight slope for a steady speed (steeper for faster), a curve for speeding up or slowing down. Mark the times and distances you are told.
Case closed
A distance–time graph tells the story of a journey: flat means at rest, a straight slope means a steady speed, a curve means speeding up or slowing down, and a falling line means coming back. The gradient of a straight part is the velocity: its size is the speed, and its sign gives the direction. Average speed is total distance travelled ÷ total time, stops included.
About this model
In the experiment the trolley's motor follows your plan exactly, but it can't change speed instantly: at the start of each part it changes its speed smoothly, by 0.5 m/s in each second, which rounds the corners of the line slightly. The sensor reads the distance to the card on the trolley's back ten times a second with no error, and the pulses on the screen are slowed down enormously. The apparatus is simulated.