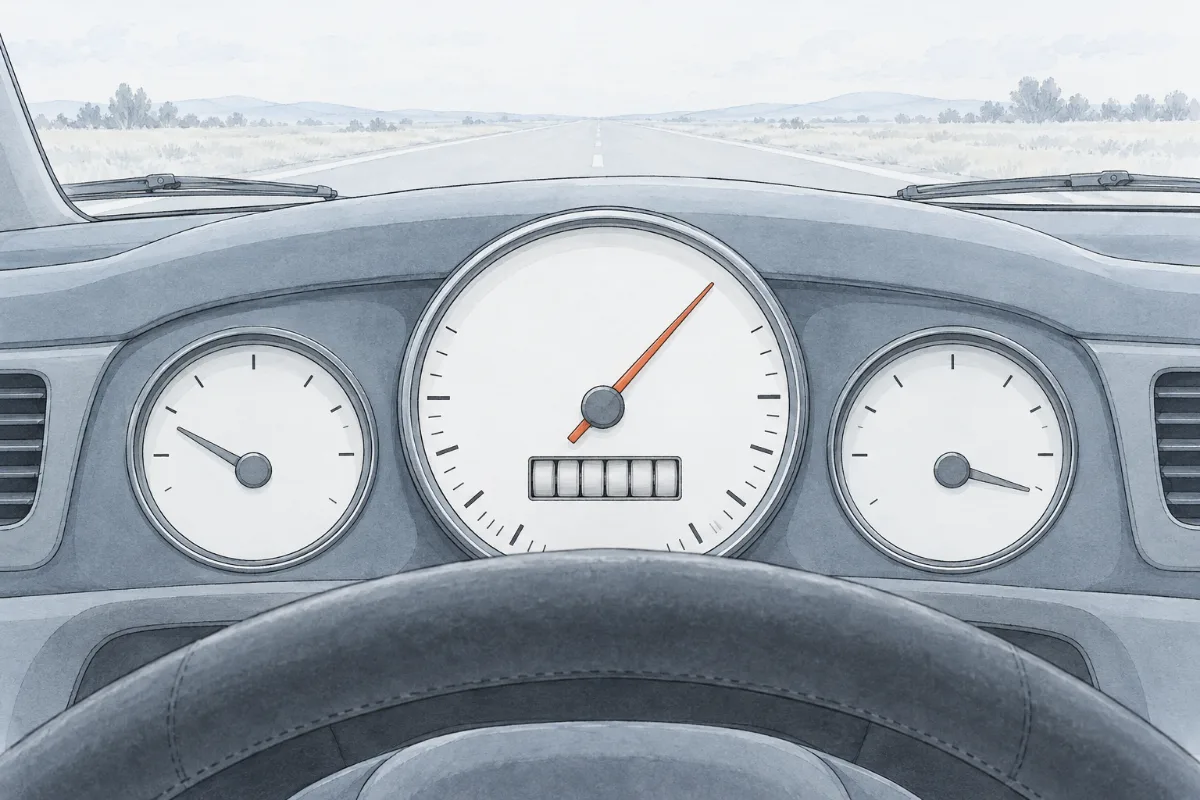
A car's dashboard has two instruments that sound alike but do different jobs. The speedometer shows how fast you are going right now. The odometer counts every metre the car has ever travelled, and it never goes backwards. Suppose you had only a graph of the speedometer readings for a trip. Could you work out how far the car went? You can: the distance is hidden in the area under the line.
 (enlarge)
A speed–time graph
A speed–time graph has time along the horizontal axis and speed up the vertical axis. It looks like a distance–time graph, but its shapes mean different things, so always read the axis labels first.
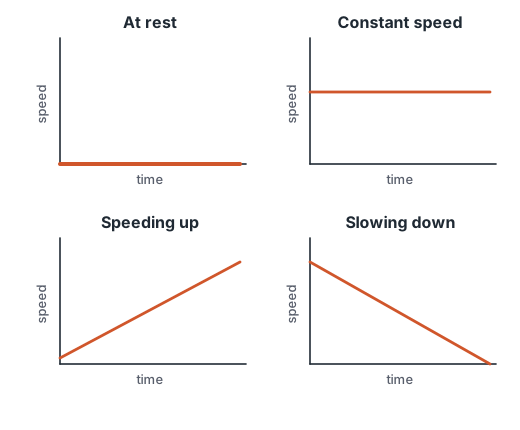
- A line along the time axis (speed zero): the object is at rest.
- A flat line above the axis: the speed isn't changing. The object moves at a constant speed.
- A line that rises: the speed is increasing. The object is speeding up, or accelerating.
- A line that falls: the speed is decreasing. The object is slowing down, or decelerating.
 (enlarge)
Trap: “A flat line means it has stopped.” That is true on a distance–time graph, not on a speed–time graph. A flat line above the axis on a speed–time graph means the object keeps moving at the same speed. Only a line along the time axis, at zero speed, means at rest.
A falling line on a speed–time graph means slowing down, not coming back: the speed gets smaller, whichever way the object is going. A speed–time graph doesn't show the direction at all.
Worked example
Reading a speed–time graph
A trolley's speed–time graph: zero from 0 to 1 s; a straight rise to 0.30 m/s at 4 s; flat at 0.30 m/s until 6 s; a straight fall to zero at 8 s; zero until 9 s. Describe the journey.
From 0 to 1 s the speed is zero: at rest. From 1 s to 4 s the line rises steadily: the trolley speeds up evenly from rest to 0.30 m/s. From 4 s to 6 s the line is flat at 0.30 m/s: constant speed. From 6 s to 8 s it falls steadily to zero: the trolley slows down evenly and stops. From 8 s to 9 s it is at rest again.
The area under the line
At a constant speed, distance = speed × time. On a speed–time graph that is the height of the flat line times its width: the area of the rectangle underneath it. A trolley moving at 0.30 m/s for 2 s travels 0.30 m/s × 2 s = 0.60 m, and the rectangle under that part of the graph is 0.30 m/s high and 2 s wide: 0.60 m. Check the units: an area on this graph is (m/s) × s = m, a distance.
So the area under a speed–time graph is the distance travelled. But what about the parts where the speed is changing, like the rise and the fall in W04?
Run the journey
The trolley in W04 starts 0.40 m from the motion sensor and moves away. Predict first: how far will it travel? Only the rectangle under the flat part, the whole shaded area, or its top speed for all the time it moves? Then run the journey and watch the shaded area grow as the trolley moves. Where does it stop on the track?
The trolley stopped at 1.75 m, 1.35 m further along the track. That is more than the rectangle's 0.60 m, so the parts where it sped up and slowed down count too, but less than 0.30 m/s × 7 s = 2.10 m, because it wasn't at full speed the whole time.
Triangles and trapezia
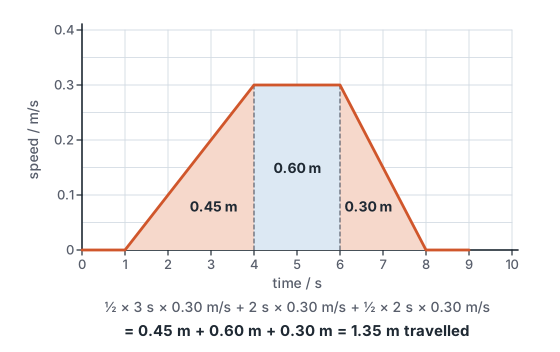
When the speed changes evenly, the area idea still works. A trolley speeds up evenly from rest to 0.30 m/s in 3 s. Its speed rises evenly from 0 to 0.30 m/s, so its average speed is halfway between them, 0.15 m/s. It travels 0.15 m/s × 3 s = 0.45 m. That is the area of the triangle under the rising line: ½ × base × height = ½ × 3 s × 0.30 m/s = 0.45 m.
To find a distance, split the area under the graph into shapes you know: rectangles for constant speed, triangles where the speed starts or ends at zero, and trapezia where it changes evenly between two speeds.
 (enlarge)
Worked example
Distance from the area
How far does the trolley in W04 travel?
Triangle under the rise: ½ × 3 s × 0.30 m/s = 0.45 m. Rectangle under the flat part: 2 s × 0.30 m/s = 0.60 m. Triangle under the fall: ½ × 2 s × 0.30 m/s = 0.30 m. The two rests add nothing: zero speed, zero area. Total distance travelled = 0.45 + 0.60 + 0.30 = 1.35 m, which is exactly how far the trolley moved along the track. A common slip is to forget the ½ for the triangles, or to multiply the top speed by the whole time.
Same journey, two graphs
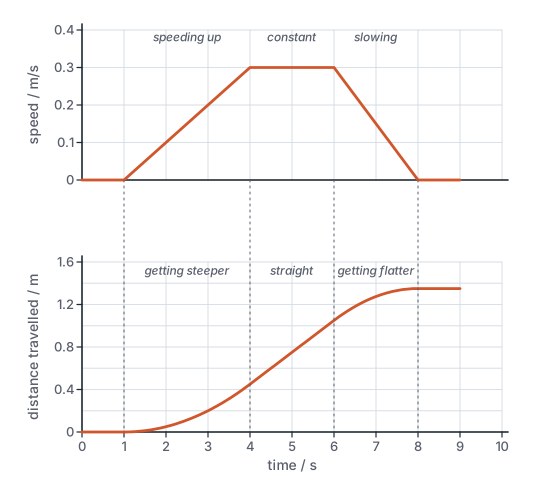
The speed–time graph and the distance–time graph of one journey tell the same story in two ways. While the trolley speeds up, its distance–time line curves upwards, getting steeper. At a constant speed it is straight. While the trolley slows down it curves over, getting flatter, and when it stops the line is flat.
 (enlarge)
So the gradient of the distance–time graph at any moment is the height of the speed–time graph at that moment, and the area under the speed–time graph up to any moment is how far the distance–time graph has climbed.
Worked example
A bus between two stops
A bus pulls away from a stop and speeds up evenly to 12 m/s in 10 s. It travels at 12 m/s for 40 s, then slows down evenly and stops at the next stop 15 s later. (a) How far apart are the stops? (b) What is the bus's average speed?
(a) Speeding up: triangle, ½ × 10 s × 12 m/s = 60 m. Constant speed: rectangle, 40 s × 12 m/s = 480 m. Slowing down: triangle, ½ × 15 s × 12 m/s = 90 m. Total: 60 + 480 + 90 = 630 m. (The whole shape is a trapezium: ½ × (40 s + 65 s) × 12 m/s = 630 m, the same answer.) (b) Average speed = total distance ÷ total time = 630 m ÷ 65 s = 9.7 m/s.
Drawing a speed–time graph
To sketch a speed–time graph from a description, label the axes “time / s” and “speed / m/s”. Draw one straight piece for each stage: along the axis while at rest, flat for a constant speed, rising for speeding up evenly, falling for slowing down evenly. Mark the speeds and times you are told at the corners, so the areas can be worked out. To plot one from a table, mark each reading with a small cross and join them part by part, as for a distance–time graph.
Case closed
On a speed–time graph, along the axis means at rest, flat means constant speed, rising means speeding up and falling means slowing down. The area under the line is the distance travelled: rectangles for constant speed, triangles (½ × base × height) and trapezia where the speed changes evenly. Average speed is still total distance ÷ total time.
About this model
In the experiment the trolley's speed changes in straight pieces exactly as the graph on the controller says, with no friction or wheel slip, and the distance is the exact area under that graph. A real trolley's speed would wobble a little, so a real area would be found by counting squares or splitting it into shapes. The apparatus is simulated.