The traffic lights turn green. A motorbike and a delivery van pull away side by side, and both end up at 24 m/s, about 86 km/h. The motorbike gets there in 4 seconds; the van takes 12. At the end neither is going faster than the other, so what was different? The motorbike's speed changed more quickly. How quickly a speed changes has a name of its own, and a number you can work out.
How quickly the speed changes
Watch the motorbike's speedometer second by second: 0, 6, 12, 18, 24 m/s. Its speed grows by 6 m/s in every second. The van's speed grows by only 2 m/s in every second: 0, 2, 4, 6 … 24 m/s. That change in speed each second is the acceleration.
Acceleration is the change in velocity per unit time:
acceleration = change in velocity ÷ time taken, or a = Δv / Δt
The symbol Δ (the Greek capital letter delta) means “change in”. Δv is the final velocity minus the starting velocity, and Δt is the time the change took. Velocity is speed in a given direction. Everything in this module moves along a straight line in one direction, so the change in velocity is simply the change in speed.
The unit comes straight from the calculation: metres per second, divided by seconds. We write it m/s² and say “metres per second squared”. An acceleration of 6 m/s² means the velocity grows by 6 m/s in every second.
Trap: “A fast car has a big acceleration.” Acceleration is how quickly the speed changes, not how big it is. A car cruising along a motorway at a steady 30 m/s has zero acceleration. A bicycle pulling away from rest at only 2 m/s may have a bigger acceleration than the car.
Worked example
Motorbike and van
The motorbike speeds up from rest to 24 m/s in 4.0 s; the van takes 12 s. Calculate each acceleration.
Motorbike: a = Δv / Δt = (24 − 0) m/s ÷ 4.0 s = 6.0 m/s². Van: a = (24 − 0) m/s ÷ 12 s = 2.0 m/s². Same change in speed, three times the time, a third of the acceleration. When something does not start from rest, use the change: a bus going from 4 m/s to 10 m/s in 3.0 s has Δv = 10 − 4 = 6 m/s, so a = 6 m/s ÷ 3.0 s = 2.0 m/s², not 10 ÷ 3.
Constant or changing acceleration
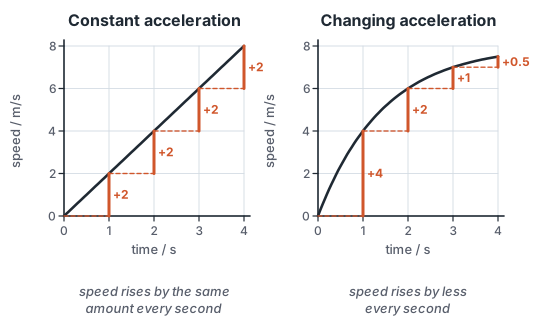
The motorbike's speed grew by the same 6 m/s every second. When the speed changes by the same amount in every second, the object has a constant acceleration. Its speed–time graph is a straight line, because each second adds the same rise.
Real journeys are often not like that. A sports car might gain 4 m/s in its first second, then 2 m/s, then 1 m/s, as it gets nearer its top speed. The speed still grows, but by less each second: the car has a changing acceleration. Its speed–time graph curves over and gets flatter.
 (enlarge)
To decide from a table, work out the change in speed in each equal time step. Here are two trolleys timed by a motion sensor:
| time / s | trolley P speed / m/s | trolley Q speed / m/s |
|---|---|---|
| 0 | 0 | 0 |
| 1 | 0.5 | 0.8 |
| 2 | 1.0 | 1.4 |
| 3 | 1.5 | 1.8 |
| 4 | 2.0 | 2.0 |
Trolley P gains 0.5 m/s every second: constant acceleration. Trolley Q gains 0.8, then 0.6, then 0.4, then 0.2 m/s: its acceleration is changing, getting smaller. A curve that gets steeper instead of flatter would mean the acceleration is getting bigger.
Acceleration from the gradient
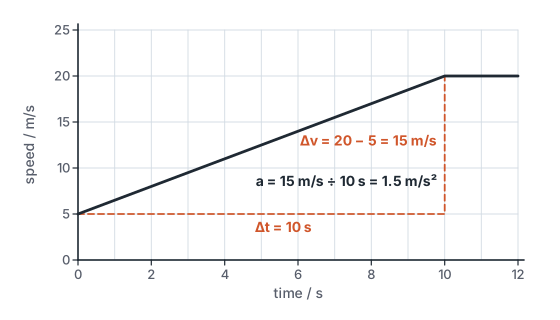
On a distance–time graph the gradient, rise ÷ run, gave the speed. On a speed–time graph the rise is a change in speed and the run is a change in time, so rise ÷ run is Δv ÷ Δt: the gradient of a speed–time graph is the acceleration. A steeper line means a bigger acceleration; a flat line means zero acceleration, a constant speed.
 (enlarge)
Worked example
A train's acceleration from its graph
A train's speed–time graph rises in a straight line from 5 m/s at 0 s to 20 m/s at 10 s, then stays flat. Calculate the acceleration in the first 10 s, and state it after 10 s.
Draw a triangle under the straight part and read both sides from the axes. Rise: Δv = 20 − 5 = 15 m/s. Run: Δt = 10 − 0 = 10 s. Gradient = 15 m/s ÷ 10 s = 1.5 m/s². After 10 s the line is flat, so the speed does not change: the acceleration is zero. A common slip is to read only the final speed, 20 m/s, and get 2.0 m/s². The train did not start from rest, so use the change.
Slowing down: deceleration
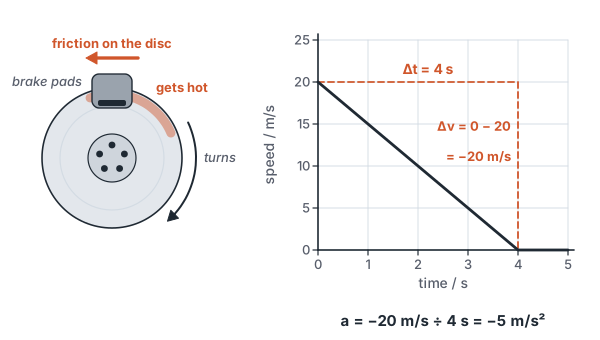
Now the speed falls. A car travelling at 20 m/s brakes and stops in 4.0 s. The final speed is smaller than the starting speed, so the change in velocity is negative: Δv = 0 − 20 = −20 m/s. The acceleration is negative too:
a = Δv / Δt = −20 m/s ÷ 4.0 s = −5.0 m/s²
A negative acceleration is a deceleration: the speed gets smaller by 5.0 m/s in every second. You can say the car's acceleration is −5.0 m/s², or that its deceleration is 5.0 m/s²; both mean the same. On a speed–time graph a deceleration is a line that slopes down, with a negative gradient.
 (enlarge)
Trap: “A negative acceleration means the car goes backwards.” The car in the example moves forwards the whole time. The minus sign says that its velocity is getting smaller, not that it has turned round.
Brakes and solid friction
What actually slows the car? When the driver presses the brake pedal, brake pads squeeze a metal disc that turns with the wheel. Where two solid surfaces rub against each other there is a force between them called friction, or solid friction. It acts against the motion of the surfaces, so it slows the disc and the wheel down.
Friction does something else too: it heats the surfaces. Racing cars brake so hard that their discs glow red hot. Rub your hands together quickly and you can feel the same effect. Friction can also stop things moving in the first place: a heavy box on the floor may not slide at all when you push it gently. So friction is a force between two surfaces that can slow down or stop motion, and that heats the surfaces.
Worked example
A cyclist brakes
A cyclist slows down from 8.0 m/s to 2.0 m/s in 3.0 s. Calculate the acceleration, and state the deceleration.
Δv = final − starting = 2.0 − 8.0 = −6.0 m/s. a = −6.0 m/s ÷ 3.0 s = −2.0 m/s². The acceleration is −2.0 m/s², so the deceleration is 2.0 m/s². Always subtract in the same order, final minus starting; then the sign takes care of itself. The bicycle's brakes work like the car's: friction between the brake blocks and the turning wheel rims acts against the turning, so it slows the wheels down and heats the rims.
Falling freely
Now let go of something. A falling object speeds up, so it accelerates. But by how much, and do heavy things accelerate more? Hold a steel ball and a feather at the same height and let them go together. Most people expect the heavy ball to win, and in air it does, easily. The question is why.
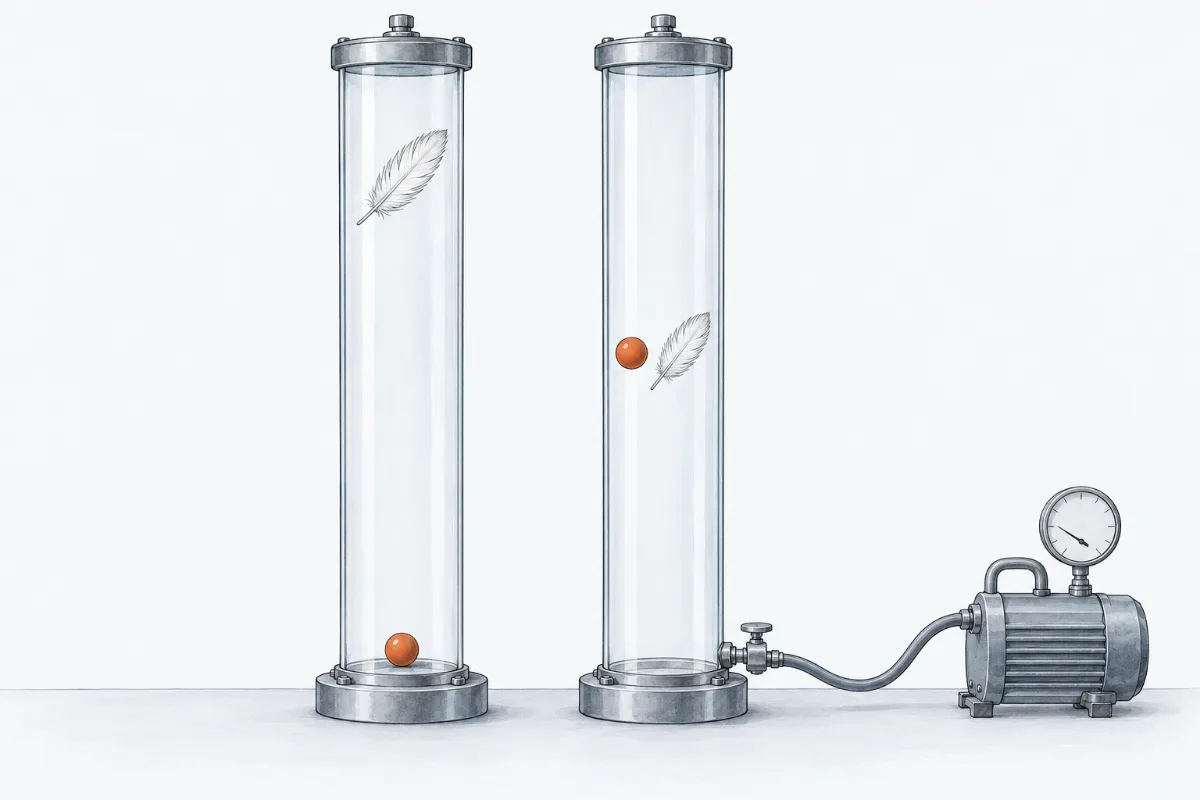
The experiment has a tall clear tube with a steel ball and a feather in a catch at the top, and a vacuum pump that can take the air out. A strobe lamp flashes 10 times a second and leaves a faint image of each object at every flash, so the gaps show how far each one fell in each 0.1 s. Predict first: which will reach the floor of the tube first in air? Then pump the air out and predict again. Watch the gaps between the faint images, and the lines on the speed–time graph. Last, use the table of speeds to find the acceleration.
What the drops showed
Do the experiment before you read on. In air the ball landed after 0.45 s, while the feather drifted down and took about 1.3 s. With the air pumped out, the ball and the feather fell side by side, level at every flash, and landed together. So the feather was slow because of the air, not because it is light: you will see how air pushes back on a falling object in the next part.
 (enlarge)
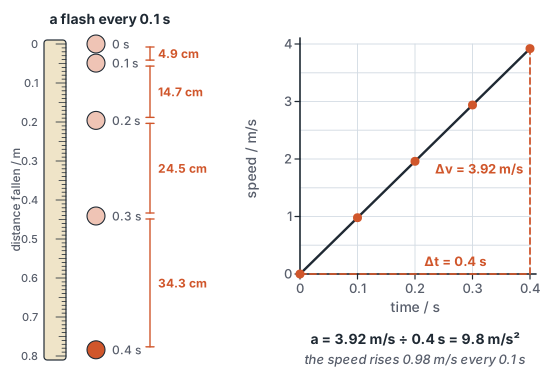
The strobe images also show how the speed grows. In each 0.1 s the ball fell further than in the one before, and its speed at each flash was 0, 0.98, 1.96, 2.94 and 3.92 m/s. The speed grows by the same 0.98 m/s every 0.1 s, so the speed–time graph is a straight line: a constant acceleration. Its gradient is 3.92 m/s ÷ 0.4 s = 9.8 m/s².
 (enlarge)
An object falling with only gravity acting on it, with no air to push back, is in free fall. Near the surface of the Earth every object in free fall has the same acceleration, the acceleration of free fall, written g. It is approximately constant, and approximately 9.8 m/s²: a falling object gains about 9.8 m/s of speed in every second, whether it is a feather, a ball or a bus.
The value changes very slightly from place to place: it is a little smaller at the top of a high mountain, for example. Use 9.8 m/s². In 1971 the astronaut David Scott dropped a hammer and a feather on the Moon, where there is no air at all. They landed together.
Trap: “Heavier things fall faster.” Without air, everything falls with the same acceleration, 9.8 m/s² near the Earth. In everyday life a feather or a sheet of paper falls slowly because the air pushes back on it, not because it is light.
Worked example
A dropped phone
A phone slips out of a pocket and falls from rest for 0.60 s before it hits the floor. The air hardly slows it. Calculate its speed just before it lands. Would a heavier phone land faster?
The phone is in free fall, so its acceleration is g = 9.8 m/s²: its speed grows by 9.8 m/s in every second. From a = Δv / Δt, the change in speed is Δv = a × Δt = 9.8 m/s² × 0.60 s = 5.9 m/s. It started from rest, so it lands at about 5.9 m/s. A heavier phone would land at the same speed, because in free fall every object has the same acceleration.
Case closed
The motorbike won the race to 24 m/s because its speed grew faster: acceleration is the change in velocity per unit time, a = Δv / Δt, in m/s². A straight speed–time graph means constant acceleration; a curved one means changing acceleration; the gradient is the acceleration. When an object slows down, Δv is negative and so is its acceleration: a deceleration. Friction between solid surfaces, as in brakes, slows things down and heats the surfaces. In free fall near the Earth every object accelerates at about 9.8 m/s², the acceleration of free fall g.
About this model
The tube, the pump and the strobe lamp are simulated. The ball and the feather follow a falling model with g = 9.8 m/s² and an air resistance that grows with speed; it is tiny for the steel ball and large for the feather. The fall is shown 5 times slower than real, but every time and every speed on the graph is the real one. A real pump would take longer to empty the tube, and a real feather would flutter and tumble.