Pupil sheet · Speed and motion graphs
Speed and motion graphs — final check
Name ______________________ Date ____________
Work alone, with the lesson closed. Answer every question; there are no hints.
1. describe / calculate / state
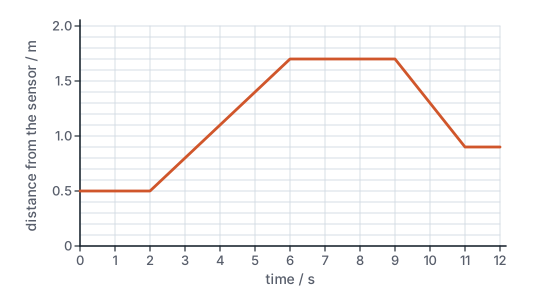
The graph shows a toy car's distance from a motion sensor. (a) Describe the car's motion in each of the five parts. (b) Calculate its speed between 2 s and 6 s. (c) State its velocity and its speed between 9 s and 11 s, taking away from the sensor as positive, and explain why they are different. (d) Calculate the total distance travelled and the average speed for the whole 12 s. (e) On paper, copy the graph and continue it to 18 s: at 12 s the car moves away from the sensor at a steady 0.20 m/s for 3 s, then stays still.
(a) The motion in each part
(b) Speed between 2 s and 6 s
(c) Velocity and speed between 9 s and 11 s, and why they differ
(d) Distance travelled and average speed
(e) How you continued the graph: each part with times and distances
2. describe / calculate
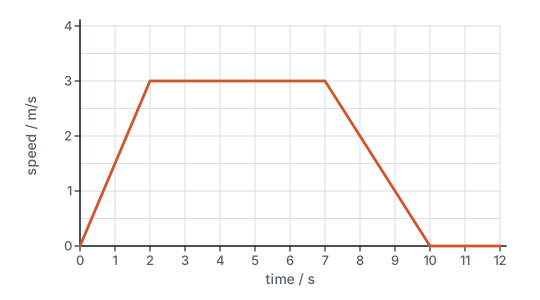
The speed–time graph shows a lift going up from the ground floor. (a) Describe its motion in each part. (b) Calculate how far it rises. (c) Calculate its average speed over the 12 s. (d) On paper, sketch the shape of the lift's distance–time graph for the 12 s, part by part.
(a) The motion in each part
(b) Height risen, with working
(c) Average speed over 12 s
(d) Your distance–time sketch, part by part