Pupil sheet · Speed and motion graphs
The story of a journey — questions
Name ______________________ Date ____________
Try every question before you use a nudge. Write in full sentences where you are asked to explain.
1. calculate
A trolley rolls 1.2 m along a track in 6.0 s at a steady speed. Calculate its speed.
Speed of the trolley: ______________ unit ________
Nudge (only if you are stuck): Speed is distance travelled per unit time. Which number do you divide by which?
2. identify / explain
Trolley A moves away from a motion sensor at 0.3 m/s. Trolley B moves towards the same sensor at 0.3 m/s. Which statement is correct? Then explain the difference between speed and velocity.
Circle one answer.
- They have the same speed and the same velocity
- They have the same speed but different velocities
- They have different speeds but the same velocity
- Trolley B has a speed of −0.3 m/s
What is the difference between speed and velocity?
Nudge (only if you are stuck): Speed is only how fast. What extra information does a velocity carry?
3. calculate
A cyclist rides 600 m in 2.0 minutes, waits at traffic lights for 1.0 minute, then rides 900 m in 2.0 minutes. Calculate her average speed for the whole journey, in m/s.
Average speed: ______________ unit ________
Nudge (only if you are stuck): Average speed = total distance travelled ÷ total time taken. Does the time at the lights count? Change minutes to seconds.
4. identify
The graph shows a cyclist's distance from her start against time. Match each section A to D with what she is doing, using each description once.
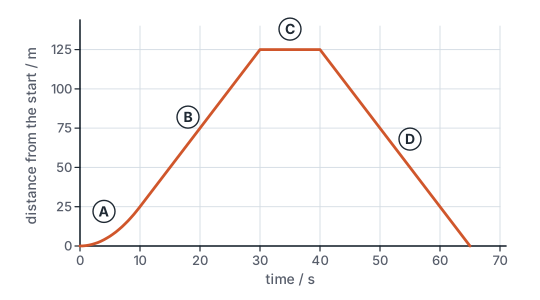
Write the number of the matching option.
- Speeding up
- Moving at a steady speed away from the start
- At rest
- Moving at a steady speed back towards the start
- Section A: ______
- Section B: ______
- Section C: ______
- Section D: ______
Nudge (only if you are stuck): For each section ask: is the distance changing? Is the line straight or curved? Does it rise or fall?
5. sketch
Sketch the distance–time graph for this walk, on paper: a dog stands still for 5 s, 2 m from its owner; then it runs straight away from the owner at a steady 4 m/s for 5 s; then it sits still for 5 s. Use distance from the owner on the vertical axis.
Axes and their labels
The shape of each part, with times and distances
Where the dog ends up, with working
Nudge (only if you are stuck): Draw one part for each stage. Where does the dog end up after running at 4 m/s for 5 s?
6. calculate
A skateboarder's distance–time graph is a straight line from 5 m at 2 s to 25 m at 6 s. Calculate the gradient of the line, and say what it tells you.
Gradient (speed): ______________ unit ________
What does the gradient tell you?
Nudge (only if you are stuck): Gradient = change in distance ÷ change in time. How much does the distance change, and over how many seconds?
7. calculate
The graph shows a girl's distance from her front door as she walks to a shop and back. Use the gradient of each straight section to calculate (a) her speed during the first 40 s and (b) her speed on the way back. (c) Give her velocity on the way back, taking away from the door as positive, and say why it is not the same as her speed.
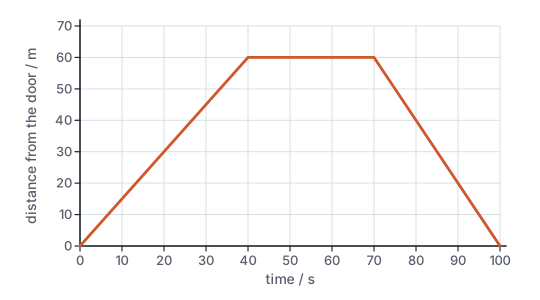
(a) Speed during the first 40 s: ______________ unit ________
(b) Speed on the way back: ______________ unit ________
(c) Velocity on the way back (away from the door positive): ______________ unit ________
(c) Why her velocity is not the same as her speed
Nudge (only if you are stuck): Gradient = change in distance ÷ change in time. Read both changes off the axes for each straight section.
8. calculate
A bus travels 1.8 km in 3.0 minutes, waits at a stop for 2.0 minutes, then travels 2.7 km in 5.0 minutes. Calculate its average speed for the whole journey in m/s.
Average speed of the bus: ______________ unit ________
Nudge (only if you are stuck): Work in metres and seconds. Which times belong in the total?
9. identify / explain
A motion sensor records a toy car's distance from its start every second. Choose every statement the data support, then explain how the table shows the car's motion.
| time / s | distance from the start / m |
|---|---|
| 0 | 0 |
| 1 | 0.10 |
| 2 | 0.40 |
| 3 | 0.90 |
| 4 | 1.60 |
| 5 | 2.50 |
Tick every correct statement.
- The car is speeding up
- The car moves at a steady speed
- Its distance–time graph is a curve that gets steeper
- Between 4 s and 5 s its average speed is 0.90 m/s
- Its average speed over the 5 s is 2.50 m/s
How does the table show the way the car is moving?
Nudge (only if you are stuck): Work out how far the car moves in each one-second interval. Do the gaps stay the same?
10. plot / describe / calculate
A motion sensor measured a trolley's distance from the sensor. (a) Plot the readings on a distance–time graph (on paper) and join them part by part. (b) Describe the motion in each part. (c) Calculate the trolley's speed between 2 s and 6 s.
| time / s | distance from the sensor / m |
|---|---|
| 0 | 0.30 |
| 2 | 0.30 |
| 4 | 0.70 |
| 6 | 1.10 |
| 8 | 1.10 |
| 10 | 0.50 |
(a) How you set up and plotted the graph
(b) The motion in each part
(c) Speed between 2 s and 6 s, with working
Nudge (only if you are stuck): Choose scales that use most of the grid: for example 1 s and 0.2 m per large square. Which readings stay the same, which change by equal amounts?
11. explain / calculate
A swimmer swims two lengths of a 50 m pool: one length out, one length back, each in 40 s at a steady speed. A graph of her distance from the starting wall rises to 50 m, then falls back to 0 m. (a) Explain why the line falls although she keeps swimming forwards. (b) What is her distance from the wall at the end, and what distance has she travelled? (c) Calculate her average speed. (d) Use the gradient of the falling part to give her velocity on the way back, taking away from the wall as positive.
(a) Why the line falls
(b) Distance from the wall and distance travelled
(c) Average speed, with working
(d) Velocity on the way back
Nudge (only if you are stuck): What does the vertical axis measure? Is that the same as the length of water she has swum through?