Pupil sheet · Speed and motion graphs
The area under the line — questions
Name ______________________ Date ____________
Try every question before you use a nudge. Write in full sentences where you are asked to explain.
1. identify
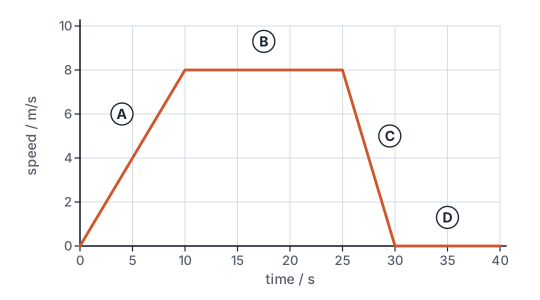
The speed–time graph shows a scooter's journey. Match each section A to D with what the scooter is doing, using each description once.
Write the number of the matching option.
- Speeding up
- Constant speed
- Slowing down
- At rest
- Section A: ______
- Section B: ______
- Section C: ______
- Section D: ______
Nudge (only if you are stuck): On a speed–time graph the height is the speed. Is the speed going up, staying the same, going down, or zero?
2. calculate
A trolley moves at a constant speed of 0.30 m/s for 4.0 s. Its speed–time graph is a flat line. Use the area under the line to find the distance it travels.
Distance travelled: ______________ unit ________
Nudge (only if you are stuck): Under a flat line the area is a rectangle: height × width. Which is the height and which is the width?
3. calculate
A cyclist speeds up evenly from rest to 6.0 m/s in 4.0 s. Her speed–time graph is a straight line from zero. Use the area under it to find how far she travels in those 4.0 s.
Distance travelled in 4.0 s: ______________ unit ________
Nudge (only if you are stuck): The shape under a line rising from zero is a triangle. What is the area of a triangle?
4. plot / describe / calculate
A motion sensor measured a trolley's distance ten times a second, and its software worked out the speed. The table gives the speed every second. (a) Plot the speed–time graph on paper and join the points part by part. (b) Describe the motion in each part. (c) Use the area under your graph to find how far the trolley travels in the first 3 s.
| time / s | speed / m/s |
|---|---|
| 0 | 0 |
| 1 | 0.10 |
| 2 | 0.20 |
| 3 | 0.30 |
| 4 | 0.30 |
| 5 | 0.30 |
| 6 | 0.30 |
(a) How you set up and plotted the graph
(b) The motion in each part
(c) Distance in the first 3 s, with working
Nudge (only if you are stuck): Put time / s across and speed / m/s up. Which readings go up by the same amount each second, and which stay the same? What shape is under the line in the first 3 s?
5. identify / explain
A graph has a horizontal straight line above the time axis. What does it show if it is (i) a distance–time graph and (ii) a speed–time graph? Choose the correct pair and explain the difference.
Circle one answer.
- (i) at rest; (ii) at rest
- (i) constant speed; (ii) constant speed
- (i) at rest; (ii) constant speed
- (i) constant speed; (ii) at rest
Why does the same shape mean different things?
Nudge (only if you are stuck): What is on the vertical axis in each case, and what does it mean if that quantity doesn't change?
6. calculate
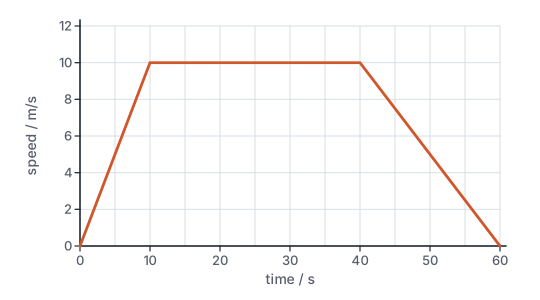
The speed–time graph shows a bus travelling between two stops. Calculate the distance between the stops.
Distance between the stops: ______________ unit ________
Nudge (only if you are stuck): Split the area into a triangle, a rectangle and a triangle. Read each base and height off the axes.
7. sketch / calculate
A lift starts from rest and speeds up evenly to 2.0 m/s in 2.0 s. It moves at 2.0 m/s for 6.0 s, then slows down evenly to rest in 2.0 s. (a) Sketch its speed–time graph on paper, with labelled axes and the speeds and times marked at the corners. (b) Calculate how far the lift travels.
(a) Your sketch: axes, shape and marked values
(b) Distance travelled, with working
Nudge (only if you are stuck): Three straight pieces. Then split the area under them into shapes.
8. calculate / describe
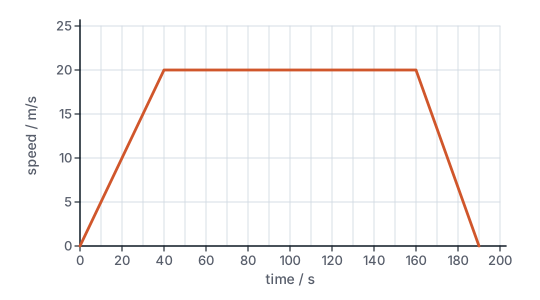
The speed–time graph shows a train between two stations. (a) Calculate the distance between the stations. (b) Calculate the train's average speed. (c) Describe the shape of the train's distance–time graph for each of the three parts of the journey.
(a) Distance between the stations, with working
(b) Average speed, with working
(c) Shape of the distance–time graph in each part
Nudge (only if you are stuck): Area for the distance; total distance ÷ total time for the average. For (c): speeding up, steady and slowing down each give a different shape on a distance–time graph.