Put a pan of ice on a hob and keep the heat steady. Will the thermometer climb steadily from freezing to boiling? Most people expect it to. In this part you'll melt and boil a block of ice, read its heating curve and explain what you see with particles.
Melting: solid to liquid
To explain what you'll see, use kinetic particle theory: all substances are made of particles that are always moving. Heating gives them more energy. The higher the temperature, the faster the particles move on average.
Start with ice at −10 °C and heat it. At first the temperature rises. The molecules vibrate faster and faster about their fixed positions.
At 0 °C something new happens: the ice starts to turn into liquid water. A solid changing into a liquid is melting. The temperature at which it happens is the melting point. For pure water (nothing else mixed in) at normal atmospheric pressure (the usual air pressure at sea level), it's 0 °C.
The flat part of the graph
Before you switch on the hotplate below, predict: will the temperature rise steadily all the way to 100 °C? If not, where will it stop rising, and for how long?
Heat it and watch
Predict what the thermometer will do, then switch on the hotplate. A reading goes into the table every 30 s; watch the graph, and the molecules to the right of the divider.
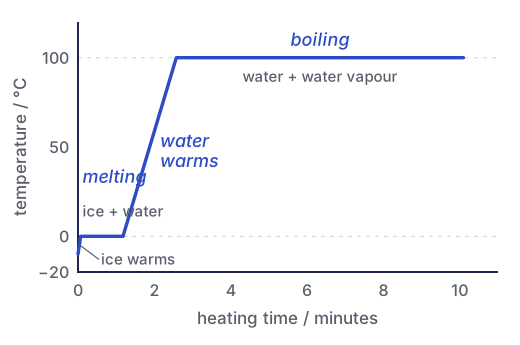
Did your graph go flat? While ice and liquid water are both in the beaker, the temperature stays at 0 °C, even though the hotplate is on. Energy is still going in. It's used to overcome the forces of attraction that hold the molecules in their fixed positions (part 1). The molecules aren't moving faster on average, so the temperature doesn't rise. Only when all the ice has melted does the temperature climb again.
Key idea: During a change of state, the energy supplied overcomes forces of attraction between particles instead of making them move faster. The temperature stays constant until the change is complete.
Trap: “No energy goes in while the graph is flat.” The hotplate is still heating. The energy is used to change the state, not to raise the temperature.
Boiling: liquid to gas
Keep heating. The water warms from 0 °C to 100 °C, and its molecules move faster. At 100 °C, bubbles appear throughout the liquid, not just at the top. Each bubble is water vapour, a gas, forming inside the liquid.
This is boiling. The boiling point of pure water at normal atmospheric pressure is 100 °C. The graph goes flat again. Now the energy separates the molecules completely, so they can move far apart as a gas.
Look at the two flat parts of your graph. Boiling lasts much longer than melting. Pulling the molecules right apart takes far more energy than freeing them to slide past each other.
 (enlarge)
Evaporation is not boiling
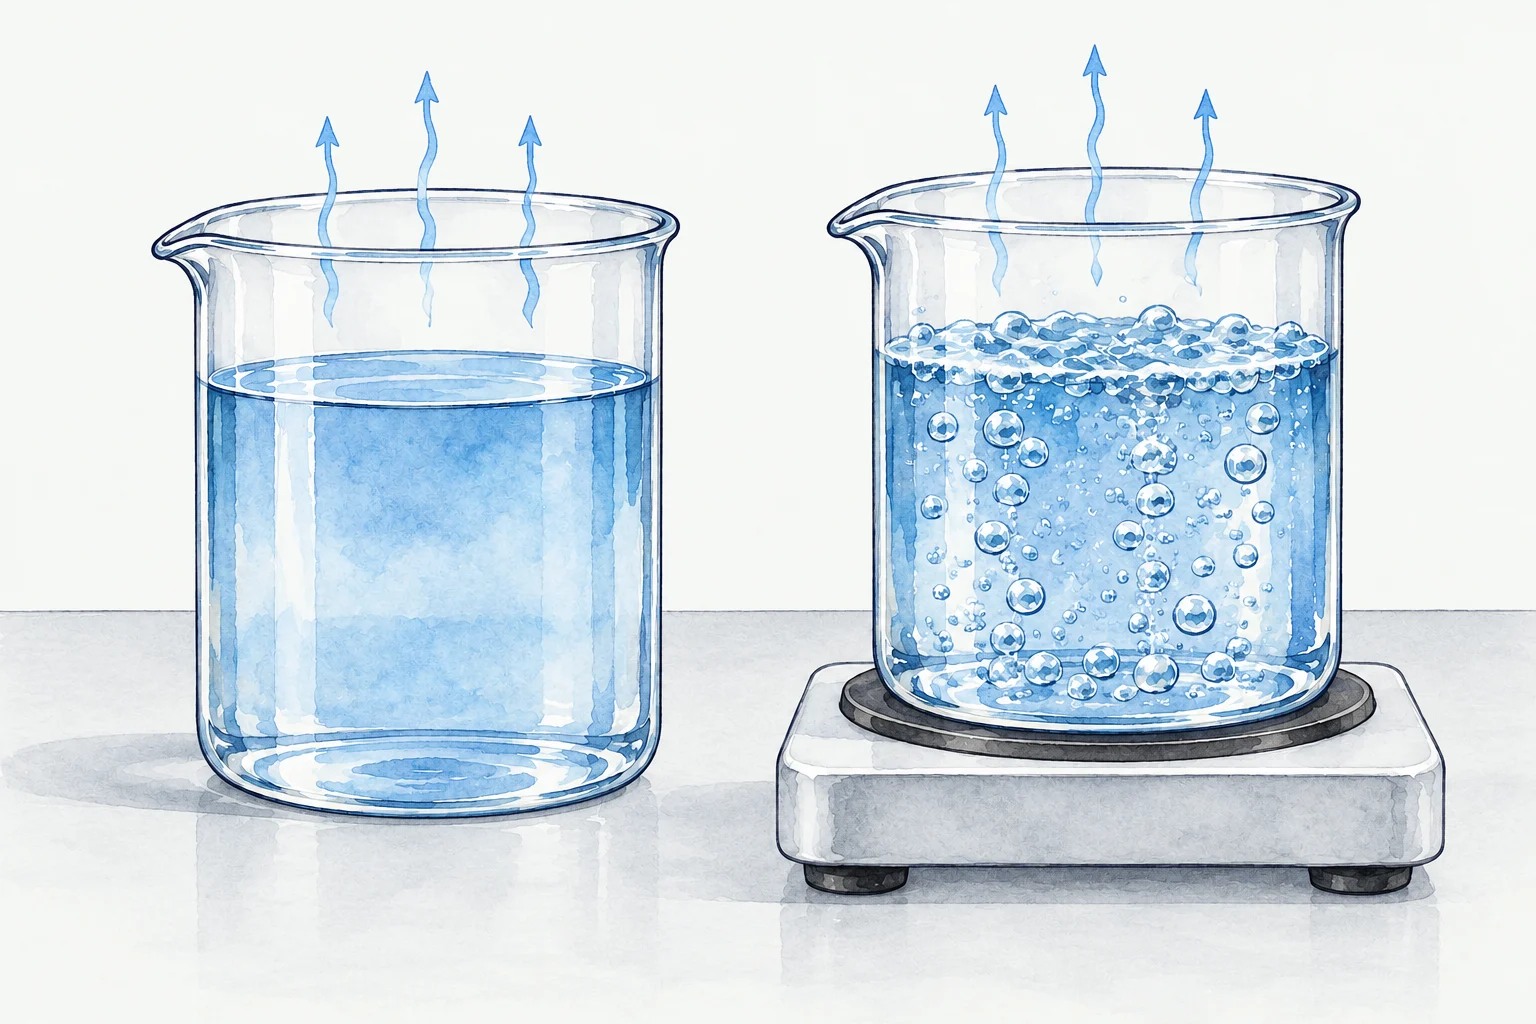
A puddle dries on a cool day without ever reaching 100 °C. That's evaporation: a liquid turning into a gas at its surface, at temperatures below its boiling point.
The molecules in a liquid don't all move at the same speed. A few near the surface move fast enough to escape the attraction of their neighbours, and they leave as a gas. Boiling is different: it happens at the boiling point, throughout the liquid, with bubbles.
Hot is not the same as boiling. Water at 80 °C evaporates quickly, but it doesn't boil: bubbles of vapour don't form throughout it until it reaches its boiling point. (Small bubbles that appear earlier are dissolved air coming out.)
 (enlarge)
Trap: “Water has to reach 100 °C to turn into a gas.” Some water evaporates at any temperature. 100 °C is the temperature at which water boils.
Worked example
Reading a heating curve
Use the heating curve above. From just after 0 minutes to just over 1 minute, the temperature stays at 0 °C. What is happening, what is in the beaker, and why doesn't the temperature rise?
A flat part on a heating curve means a change of state. At 0 °C that change is melting, so both ice and liquid water are in the beaker. The energy supplied overcomes the forces of attraction holding the molecules in place. Their average speed doesn't increase, so neither does the temperature.
Worked example
Why does a puddle dry at 15 °C?
The puddle never gets near 100 °C and never bubbles, so it isn't boiling. It's evaporating. Some molecules at the surface move fast enough to escape into the air. Bit by bit, the whole puddle goes. It dries faster on a warm, windy day: more molecules have enough energy to escape, and the wind carries the vapour away.
Case closed
Heat a solid steadily. The temperature rises, then stays flat at the melting point while it melts. It rises again, then stays flat at the boiling point while it boils. The flat parts are changes of state: the energy overcomes forces between particles instead of raising the temperature.
Evaporation happens at the surface, below the boiling point. Boiling happens throughout the liquid, at the boiling point.
About this model
The experiment uses an ideal hotplate that loses no heat, so its curve has sharp corners. In a real beaker the corners are rounded, and some water evaporates before it boils. In the drawing, the molecules speed up more than real ones do, so that the change is easy to see.