Part 2 of 3
Where does the heat go?
identify / explain
Try it yourself
identify: name or select. explain: give reasons and connect them to evidence.
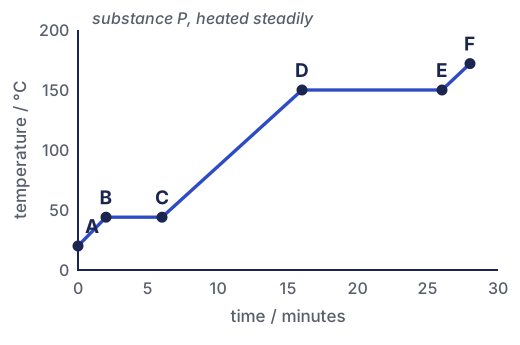
The graph shows substance P heated at a steady rate. What is the melting point of P? Explain which part of the graph tells you.
 (enlarge)
Your saved work
Answers and earlier attempts stay in this browser. Export a copy to keep, to move to another device or to hand to your teacher. Importing a copy keeps your current answers and adds earlier attempts.
Scope and sources
Cambridge IGCSE Chemistry 0620 · 2026–2028 v2 · Original learning materials.
Distinguishing properties and particle structure of solids, liquids and gases; melting, boiling, evaporating, freezing and condensing; heating and cooling curves explained with kinetic particle theory (1.1.1–1.1.3, Supplement 1.1.5). The experiment heats one ideal 50 g ice sample; freezing and condensing are taught with figures and practice. Gas volume with temperature and pressure (1.1.4, 1.1.6) comes in a later module.
Apparatus, amounts and times in the experiment are illustrative. Real practical work follows a teacher-approved safety method.
Official Cambridge syllabus